Graph a Quadratic Function (Parabola)
A quadratic y = ax² + bx + c graphs as a U-shaped parabola with its vertex at x = −b ÷ 2a; it opens upward when a > 0 and downward when a < 0.
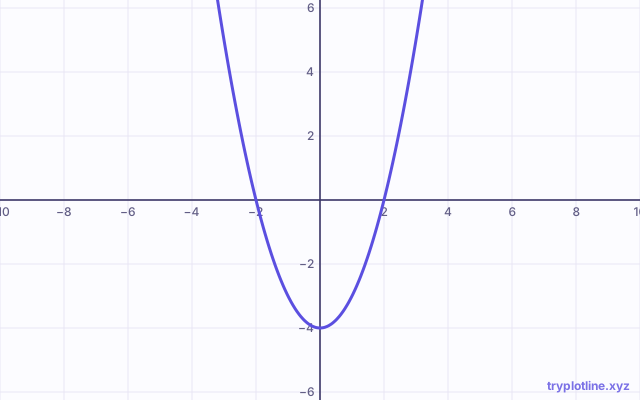
At a glance
| What it is | Graph quadratic functions y = ax² + bx + c online. Find the vertex, roots and axis of symmetry, and drag sliders for a, b and c. Free. |
|---|---|
| Type | Interactive guide with a calculator |
| Level | High school and college |
| Price | Free, with no account or sign-up |
| Works offline | Yes, after the first visit; installs as an app |
| Made by | Aalok (aalok.builds@gmail.com) |
| Last updated | 1 November 2026 |
Key facts
| Standard form | y = ax² + bx + c |
|---|---|
| Vertex | x = −b ÷ (2a), then substitute to find y |
| Axis of symmetry | The vertical line x = −b ÷ (2a) |
| Roots (x-intercepts) | x = (−b ± √(b² − 4ac)) ÷ (2a) |
| y-intercept | (0, c) |
| Example: y = x² − 4 | Vertex (0, −4), roots x = −2 and x = 2 |
What does the discriminant tell you?
The discriminant b² − 4ac tells you how many times the parabola crosses the x-axis: two real roots if it is positive, one (the vertex touches the axis) if it is zero, and none if it is negative.
What is vertex form?
Written as y = a(x − h)² + k, the vertex is simply (h, k). Changing h slides the parabola left and right, k moves it up and down, and a makes it narrower or wider.
How to use it in Plotline
- The graph of y = ax² + bx + c with sliders for a, b and c is already loaded above. Edit the equation in the list to change it.
- Drag the graph to move around, scroll or pinch to zoom, and tap the crosshair to reset the view.
- Hover over or tap the curve to read the coordinates of any point.
- Press Enter to add another equation and compare graphs in different colors.
Frequently asked questions
How do I find the vertex of a parabola?
For y = ax² + bx + c, the vertex is at x = −b ÷ (2a). Substitute that x back into the equation to get y. For y = x² − 6x + 5, x = 3 and y = −4, so the vertex is (3, −4).
How do I graph y = x²?
Type y = x^2 into Plotline. It is a parabola with its vertex at the origin, passing through (1, 1), (2, 4) and (−2, 4).
Is it free?
Yes. The graphing calculator is free with no account and no sign-up: plot as many equations as you like, use sliders, save graphs in your browser and share them by link. It installs as an app and keeps working offline.
Learn more
Related
- Linear equation – Graph linear equations y = mx + b online.
- Cubic function – Graph cubic functions online and find their roots, turning points and inflection point.
- Square root function – Graph y = √x online and learn its domain, range and key points (0,0), (1,1), (4,2), (9,3).
Free calculators
- Graphing Calculator – Graph functions, circles, inequalities, polar and parametric equations instantly.
- Scientific Calculator – Free online scientific calculator with sin, cos, tan, inverse trig, logs, powers, roots, factorials, degrees and radians.
- Basic Calculator – A simple, free online calculator for add, subtract, multiply, divide, percent, square and square root.
- Matrix Calculator – Free matrix calculator: determinant, inverse, multiplication, transpose, RREF, rank, trace and powers, with exact fractions.
Plotline is an independent project and is not affiliated with Desmos, Texas Instruments or Casio.